Transmembrane proteins are primary targets of pharmaceutical research. Their membrane bound nature often cause great experimental difficulties and prevent the access of important data about their role and function. Fortunately they are good target for bioinformatics approach. A number of algorithms designed to identify putative TM-helices in the primary amino acid sequence have been developed. These tools are performing above 90% success rate for real transmembrane sequences.
While the tools are effective in locating transmembrane segments in real TM-proteins they tend to identify hydrophobic clusters in globular proteins as transmembrane segments incorrectly. 20% - 30% of non-TM query sequences may give false positive hits in the prediction process. Strictly speaking, feeding non-TM queries into these tools is not the proper practice as these methods are not designed nor optimized for this role. The mass production of genomic sequence data put huge pressure on bioinformatics in this context. The issue of the false positive error rate of the prediction should be addressed.
Since integral membrane protein composed from more hydrophobic residue than water soluble globular proteins they can be discriminated according to their composition. Methods developed for predicting helical transmembrane segments on the basis of hyrdophobicity plot analyses were also used for discrimination analyses as well however, at a moderate success rate. The consensus of several transmembrane helix prediction methods could distinguish between water soluble and membrane proteins in certain cases. This approach is slow to apply and the outcome has not been verified for general case.
The data presented here suggests that the modified and updated version of our "Dense Alignment Surface" (DAS) algorithm - the DAS-TMfilter server - is a more effective answer to this problem. DAS is based on low-stringency dot-plots of the query sequence against a collection of library sequences - non-homologous membrane proteins - using a previously derived, special scoring matrix. The method provides a high precision hyrdophobicity profile for the query from which the location of the potential transmembrane segments can be obtained.
The principle difference between the DAS method and the hyrdophobicity profile based ones is that DAS describes the hydrophobic segments at tree levels. In the first intance an ideal TM fragment is similar to any other as they are all made up of hydrophobic residues. Secondly, if two fragments are similar then the similarity remains high even when the two fragments are shifted relative to each other. Finaly, when there are several TM fragments in both sequences we expect to see the grid-like arrengaments of similarity regions at the intersections of the TM fragments. This complex approach of hydrophobicity is the key behind the sensitivity of the DAS method.
The novelty of the DAS-TMfilter algorithm relative to the original DAS is a second - "reversed" - prediction cycle. In this step the query sequence is used to predict TM segments in the sequences of the TM-library. The result of the prediction is compared with the location of the known TM segments and the quality of the prediction computed according to the success rate. "Strong" profiles with high quality scores are obtained when the query is a real TM-protein and non-TM queries result in "weak" profiles and low quality scores. Based on this test the type of the query can be jugded. The error rate of wrong assignment is significantly lower than the direct application of any TM-prediction method alone. In this way the automated screening for TM-proteins in the unannotated genomic data seems to be possible at a reasonably low error rate.
The results of the test run on a collection of 128 experimentally documented TM proteins is available here.
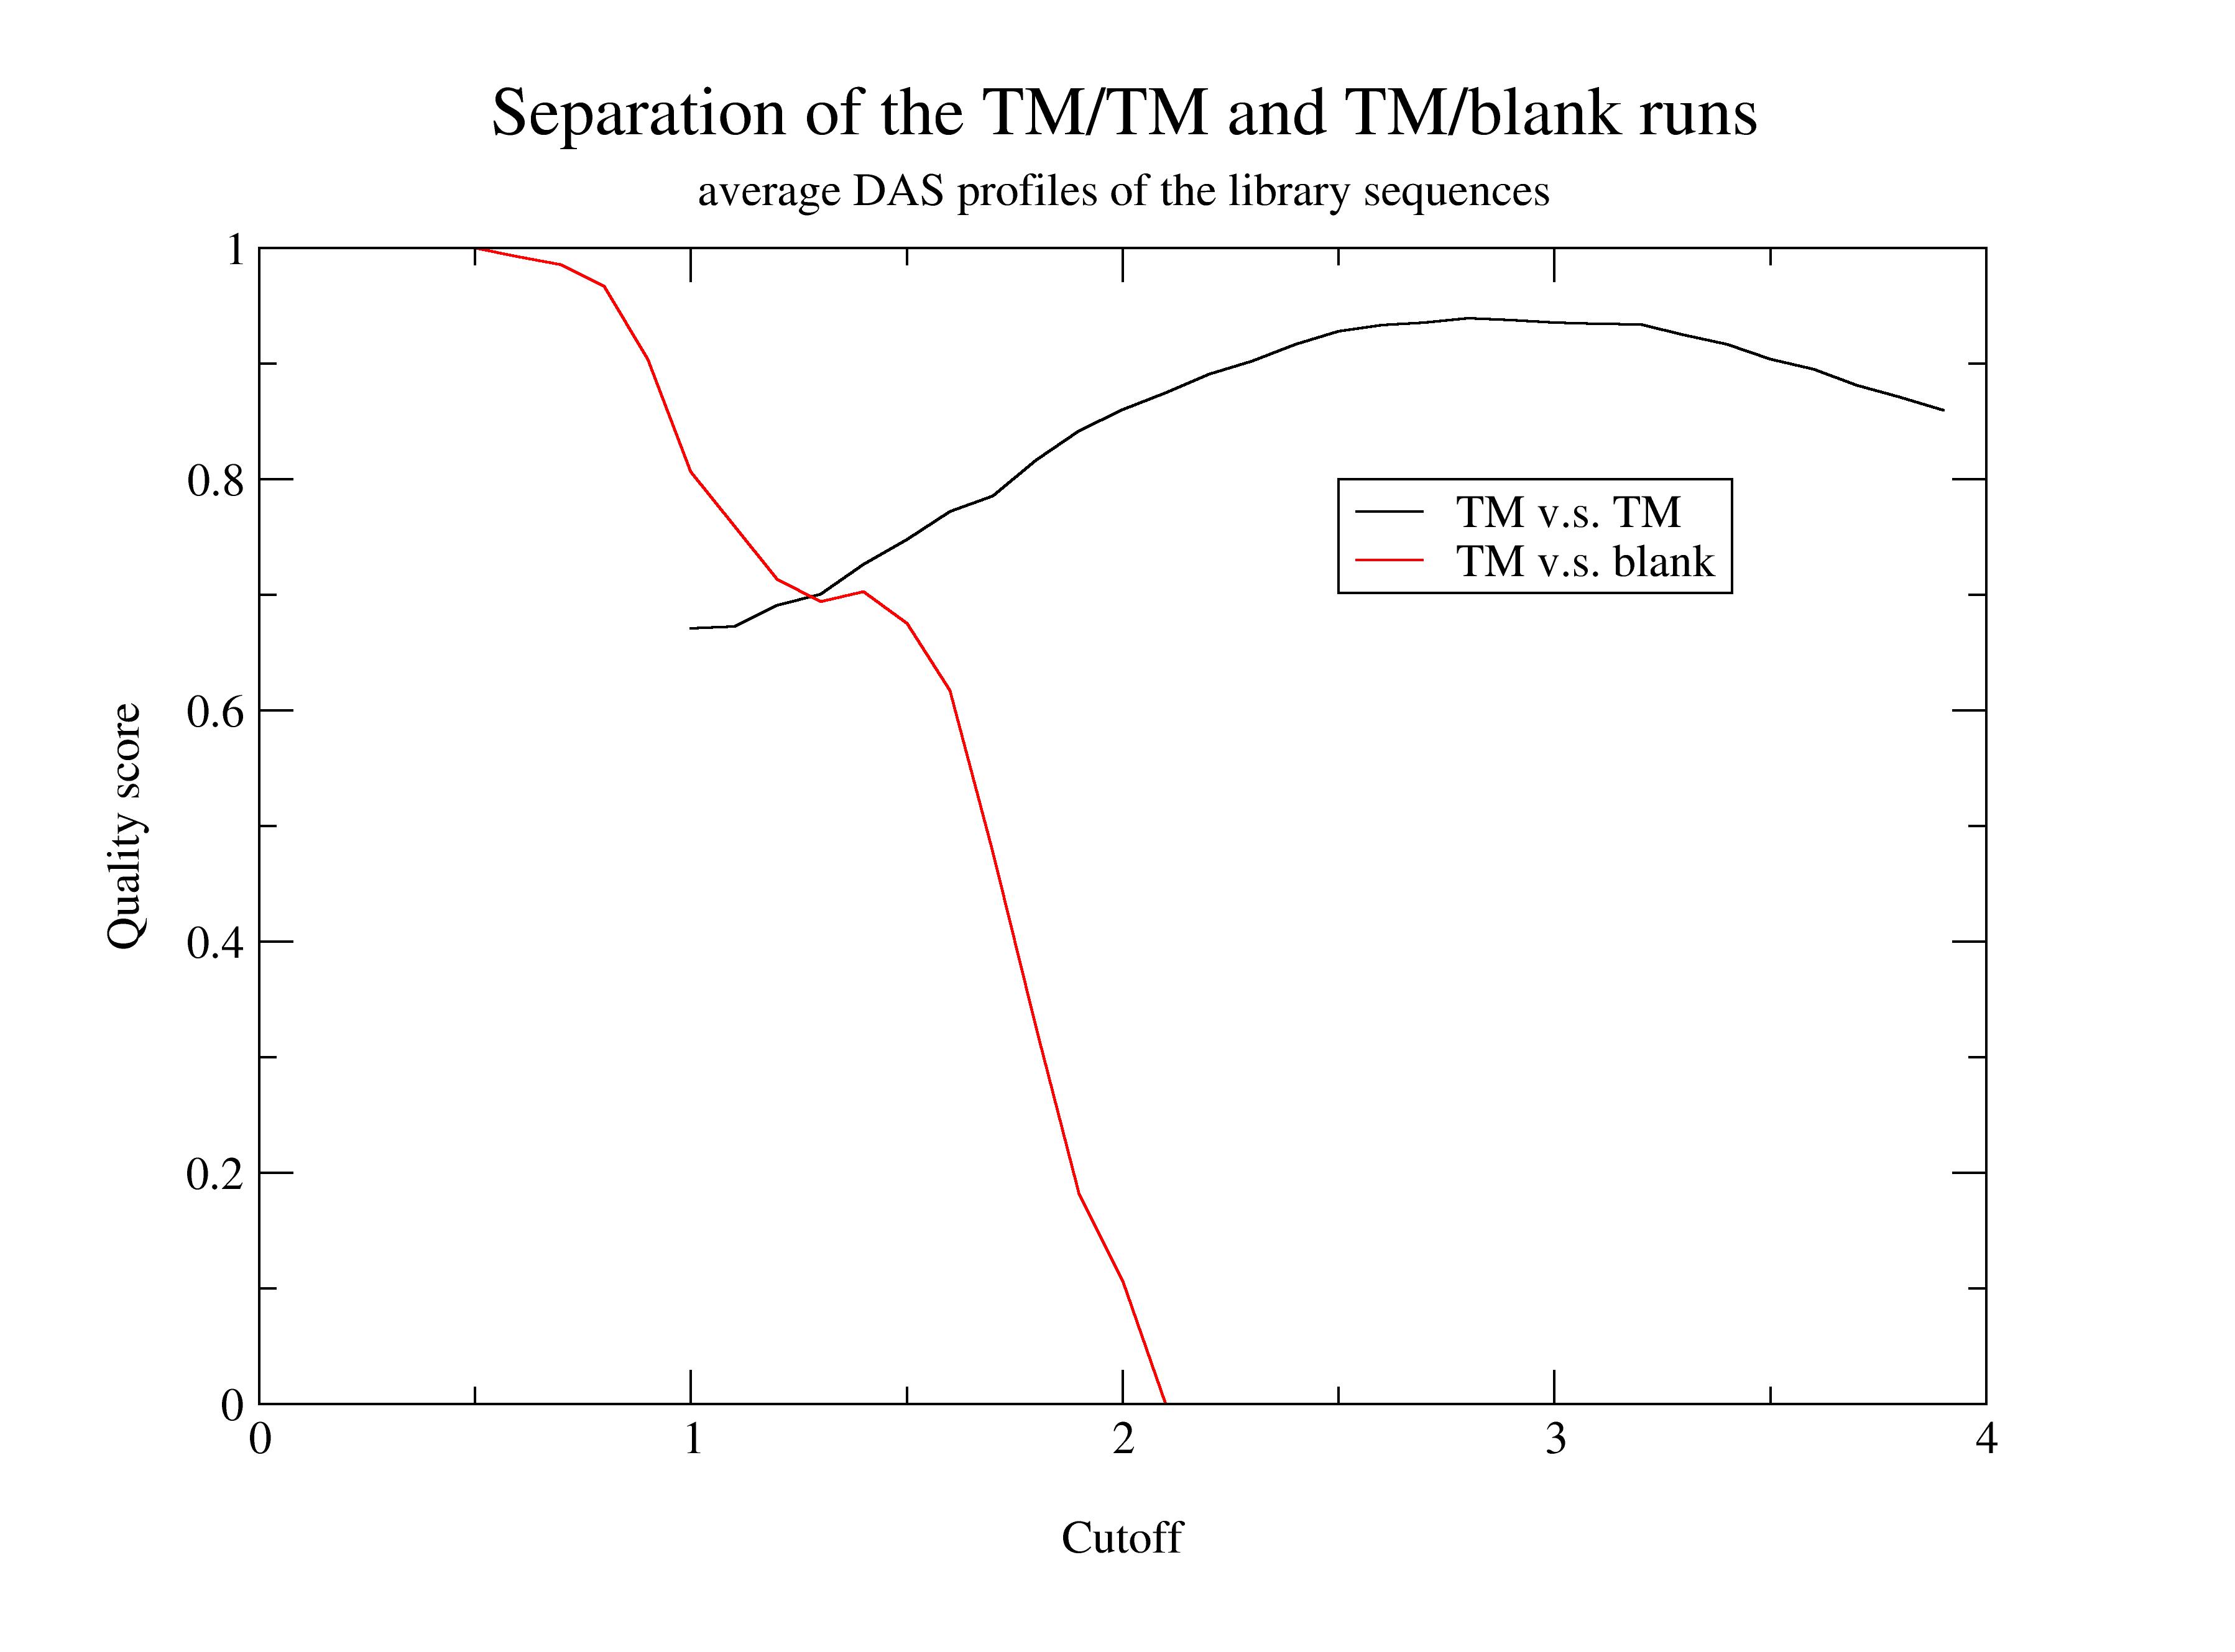
The effect of the type of the query sequence on the quality of the library sequences is demonstrated on the plot below. The predictive power of the library sequences relative to the annotation of the database at gradually increasing empirical cutoff value were computed. The black curve obtained using the TM-protein set as the query, while the red curve is the result of the non-TM query set. The quality overestimates the real efficiency at extremely low cutoff values. (See the red curve at 1.0 or below.)

The quality scores of the individual sequences of the TM set and the non-TM (blank) set plotted against the number of TM-segments detected in them by the DAS-TMfilter.
